In this article, we will share with you the importance of global warming and the value of carbon footprints and life cycle assessments. You will find examples from the cleaning & hygiene industry, applicable in your cleaning operations.
In talks about global warming and our efforts to do something about it, most people refer to the carbon footprint of their activities, the things they do, and the products they use. But what does carbon footprint mean? What is included?
In this article, we will share with you the importance of global warming and the value of carbon footprints and life cycle assessments. You will find examples from the cleaning & hygiene industry, applicable in your cleaning operations.
Greenhouse Gasses (GHGs) are gasses that are able to absorb long wave radiation (heat) that is reflected off the Earth's surface. They then reflect this radiation back down to Earth. If there were no GHGs in our atmosphere the Earth would be too cold for life as we know it to exist. However, as more fossil fuels are burnt and other GHGs are released, the atmosphere is able to absorb more radiation and so is warming up. This is known as the greenhouse effect (the same mechanism as in greenhouses) and is occurring on a global scale.
In 2014, a report on climate change was published based on long-term scientific evidence. This stated that the increase in greenhouse gas (GHG) concentrations (and that is not only carbon dioxide (CO2) but also some other gasses such as methane, nitrous oxide, and some more) over the past 100 years has predominantly been caused by human activities.
Carbon is a shorthand for all the different greenhouse gasses that contribute to global warming. Footprint is a metaphor for the total impact that something has. The term carbon footprint, therefore, is a shorthand to describe the best estimate that we can get of the full climate change impact of something, an activity, an item, a lifestyle, a company, a country, or even the whole world.
Emissions come in different shapes and formats since the emissions from harvesting raw materials are very different from the emissions from producing electricity. We try to unite these different emissions into actionable numbers. Meaning that different emissions that cause the same impact are converted into one unit. This "Global Warming Potential" is expressed in kg CO2 equivalents (kg CO2-eq). Other greenhouse gas emissions than carbon emissions (CO2) can cause climate change as well, such as methane (CH4) or laughing gas (N2O). CO2 equivalent is a metric measure used to compare the emissions from all these various greenhouse gasses on the basis of their global-warming potential (GWP), by converting amounts of other gasses to the equivalent amount of carbon dioxide with the same global warming potential.
The most common abuse of the phrase carbon footprint is to miss out on some or even most of the emissions caused, whatever activity or item is being discussed. For example, many online carbon calculator websites will tell you that your carbon footprint is a certain size based on your home energy use and personal travel habits, yet ignoring all other goods and services you purchase.
Similarly, a food wholesale company might claim to have measured its carbon footprint but in doing so looked only at its office, warehouse, and cars while ignoring the much greater emissions caused by the producers of the food themselves.
These kinds of carbon footprints are actually more like carbon 'toe-prints' they don't give the full picture.
Much confusion around footprints comes down to the distinction between direct and indirect emissions. To give an example: the true carbon footprint of driving a car includes not only the emissions that come out of the exhaust pipe, but also all the emissions that take place when oil is extracted, shipped, refined into fuel, and transported to the petrol station, not to mention the substantial emissions caused by producing and maintaining the car.
Direct or 'scope 1' emissions come from sources that are directly from the site that is producing a product or delivering a service. An example for the industry would be the emissions related to burning fuel on-site.
Scope 2 emissions are those indirectly related to purchased electricity, heat, and/or steam used on site, e.g.:
Scope 3 emissions are all other indirect emissions derived from the activities of an organisation but from sources that they do not own or control.
The GHG Protocol's Corporate Value Chain (Scope 3) Accounting and Reporting Standard allows companies to assess their entire value chain emissions impact and identify where to focus reduction activities.
Companies like us, Diversey, face the challenge of how to deal with complex situations, such as the production of a wide portfolio of products in the same factory or factories, that then are all shipped to different places around the globe. What part of total emissions is attributed to what product? The only practical way to handle this is by proportional attribution, and probably best by volume.
Life Cycle Assessment (LCA) provides a framework for measuring the impact of, for example, a product. LCA assesses various aspects of environmental impact, depending on the LCA method applied. GWP is just one of the categories. There are different LCA methods:
If you want to assess the life cycle of a product, you need to define what that life cycle actually consists of. The system boundary defines which processes will be included in, or excluded from the system; i.e. the LCA.
Life Cycle Assessment is a data-intensive, time-consuming activity with the compiling and evaluation of all inputs and outputs and the potential environmental impacts of a product system during a product's lifetime.
Software tools like Ecoinvent, GaBi, or SimaPro combine Life Cycle Assessment modeling and reporting software, and content databases with intuitive data collection and reporting tools to help in comparing impact scenarios. More than a thousand substances are classified and characterized according to the extent to which they contribute to a list of environmental impact categories. It still requires specific technical expertise and experience to complete a full LCA study.
We all feel intuitively that up-concentration of liquid cleaning products will improve sustainability as it reduces the amount of packaging material and amount of chemical being transported from production to warehouse and final use location.
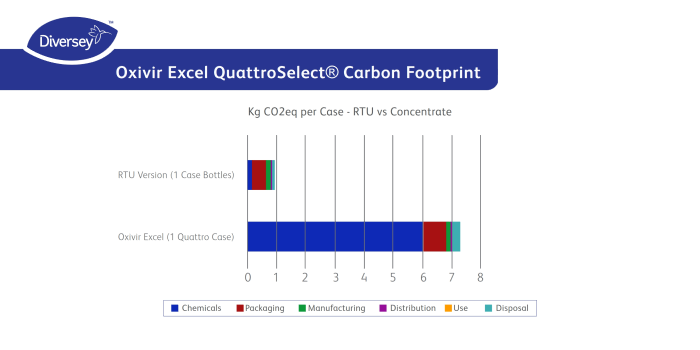
Does that show in their carbon footprint? Yes, it does. But the graph below (*) also illustrates the importance of understanding what we compare.
Here the functional unit is first a case of product. If we look at the carbon footprint of a case of ready-to-use (RTU) vs a concentrate, the RTU product has a much smaller footprint. This is due to the fact that the RTU has a lot of water and lower levels of ingredients. You need to be careful not to draw the wrong conclusion that the RTU is the better product.

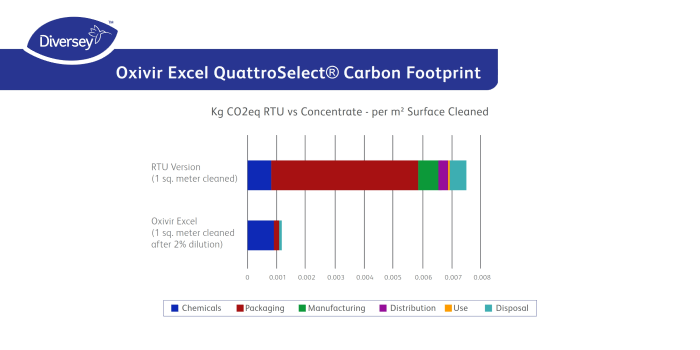
When we analyze these two solutions with a different functional unit, the results flip. Instead of measuring the carbon footprint of a case of product, we have set the functional unit to be 1 square meter of surface effectively cleaned. In this situation, the carbon footprint of the chemicals is identical but the impact of packaging, manufacturing, distribution, and disposal are worse for the RTU product.

Many companies would like to know the carbon footprint per case of product as these results would be needed for Scope 3 assessments when the total area cleaned is not known. These results, however, can be misleading if trying to identify the solution with the lowest carbon footprint. Diversey therefore always recommends using ‘effective cleaning’ (e.g. per cleaned area) as the functional unit for meaningful comparison.
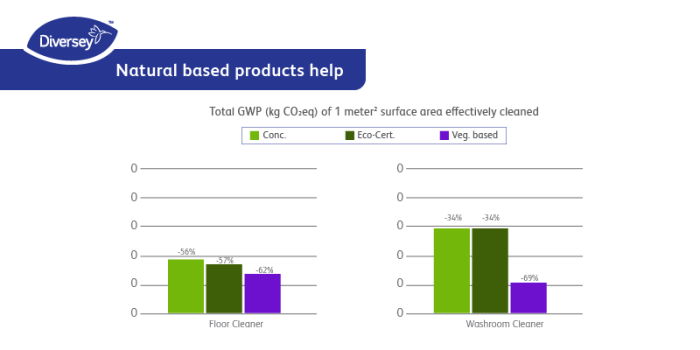
Certified green cleaning can be defined as the use of cleaning products and methods that are authorized by a 3rd party to meet certain environmental and safety criteria. For cleaning to be 'green', the products must effectively remove pollutants and hazardous ingredients without compromising on performance. They do consider the fate of the chemicals and materials used during the process and the potential harm to the environment but it doesn’t a priori mean that these products have a significantly lower GWP. That also depends on use concentration, packaging, etc.
On the graph below (*), you can see that the benefit of eco-certification is smaller than the benefit from up-concentrating the product. Petrochemical raw materials and ingredients have a high GWP. Replacing them with ‘natural’, renewable ingredients will help, as long as the ingredients come from agri- or food waste. If the crops are specially grown for producing these ingredients (and thus compete with the production of food) then the total impact of this process is much higher than using petrochemical ingredients. It is therefore critical to understand the source of the raw materials in the products. The whole benefit in GWP is coming from the difference in the source of the ingredients used in the product.

Nobody will deny the big problems we have with plastic waste. Not that plastic is so bad, but it is so bad because we use so much of it only once and then throw it away.
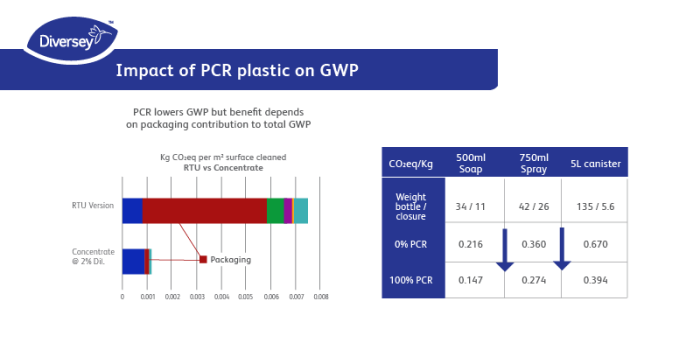
The use of Post Consumer Recycled (PCR) plastic does reduce GWP of a product. The table (*) below clearly shows that. The total benefit on a product however is dependent on the contribution of the packaging component to the total GWP of that product. It makes the most sense to move to PCR plastic with RTU products in spray trigger bottles. The benefit on the GWP of concentrated products in 1L or 5L cans is negligible. Yet, it still helps of course in reducing our global waste problem.

https://www.cdp.net/en
https://ec.europa.eu/info/strategy/priorities-2019-2024/european-green-deal_en
https://co2living.com/what-is-a-carbon-footprint-updated-2021/
https://ecochain.com/knowledge/impact-categories-lca/
(*) Calculations are based on Diversey products